

PostgreSQL Optimization: High-Concurrency Tuning & Zero Downtime
Expert autovacuum tuning, connection pool architecture, and query optimization to keep your PostgreSQL instances fast and stable.
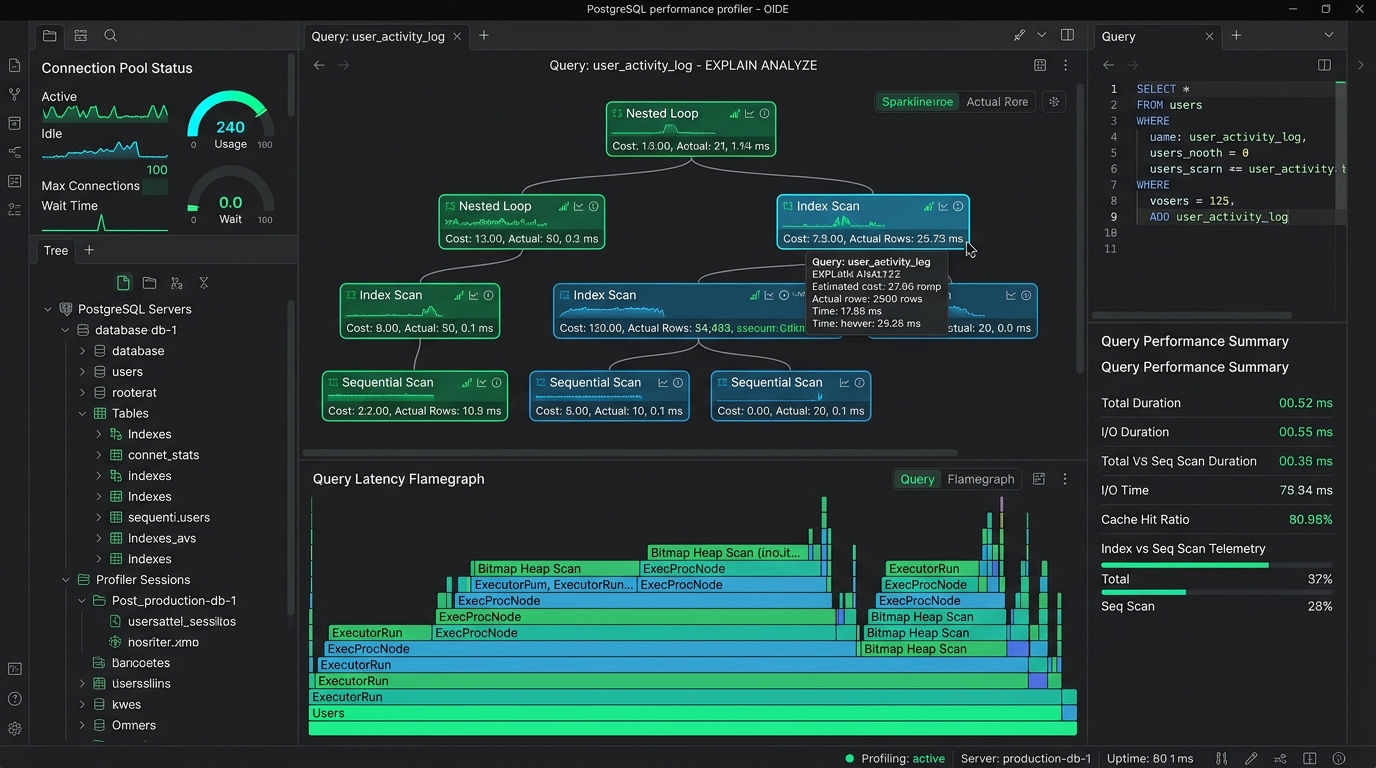
Where Bottlenecks Impact Your Customers & Revenue
Real-world friction, checkout hesitation, and performance barriers that directly reduce conversions and customer retention.
Connection Exhaustion Crashing Customer Services
Sudden surges in API traffic exhausting PostgreSQL connection limits, causing widespread service outages.
Table Bloat & Disk Space Degradation
Misconfigured autovacuum settings allowing dead rows to accumulate, bloating disk usage and slowing down index scans.
Lock Contention Halting Critical Business Transactions
Long-running migrations or unoptimized updates holding exclusive locks and blocking customer access.
Runaway Replicas & Sync Latency Risks
Replication lag during peak write volume causing read replicas to serve stale, inaccurate business data.
How We Fix It: The 14-Day Performance Sprint
A structured, milestone-driven engineering roadmap delivered directly into your staging repository with zero downtime.
Lock Tree & Bloat Analysis
Profiling active lock trees, pg_stat_activity, and dead tuple ratios via automated telemetry scripts.
PgBouncer Pooling Setup
Deployment and configuration of PgBouncer in transaction-pooling mode to support 10,000+ connections.
Autovacuum Parameter Tuning
Autovacuum parameter tuning per table (autovacuum_vacuum_scale_factor) to eliminate bloat.
Index Optimization & BRIN
Converting redundant B-Trees to partial or BRIN indexes on time-series telemetry tables.
WAL Tuning & Production Apply
Write performance optimization (WAL tuning, checkpoint configuration) and production handover.
Tangible Business Outcomes in Your Codebase
What your executive and engineering leadership receives in your production repository. Zero theoretical slide decks—only verified speed improvements, clean code diffs, and documented operational stability.
PgBouncer Pool Configuration
High-availability PgBouncer setup managing thousands of concurrent application connections.
Customized postgresql.conf
Memory and maintenance parameters tailored for your hardware and transaction profile.
Automated Maintenance Runbook
Scripts and cron jobs automating bloat monitoring and non-blocking re-indexing.
Logistics Fleet Management Platform (RDS PostgreSQL)
Connections Capped at 500 | Max CPU Spikes Every 2 Hours | Dead Tuple Bloat: 45GB
Explore Audit Scope ↗Verified Production Telemetry Delta
PgBouncer handling 4,500 connections | CPU Utilization < 25% | Bloat Purged | Queries 5x Faster
Related Engineering Workstreams
Looking for general database query optimization? Explore Database Performance Tuning.
Need an in-memory cache to offload Postgres? Review our Redis Caching Architecture.
Tune Your PostgreSQL Cluster
No exploratory sales calls. Direct asynchronous code remediation and engineering triage.
Strict non-disclosure agreement executed before configuration reviews.