

Database Performance Tuning: Millisecond Queries Under Peak Load
Eliminate query timeouts, resolve concurrency deadlocks, and optimize indexing so your database effortlessly handles massive traffic spikes.
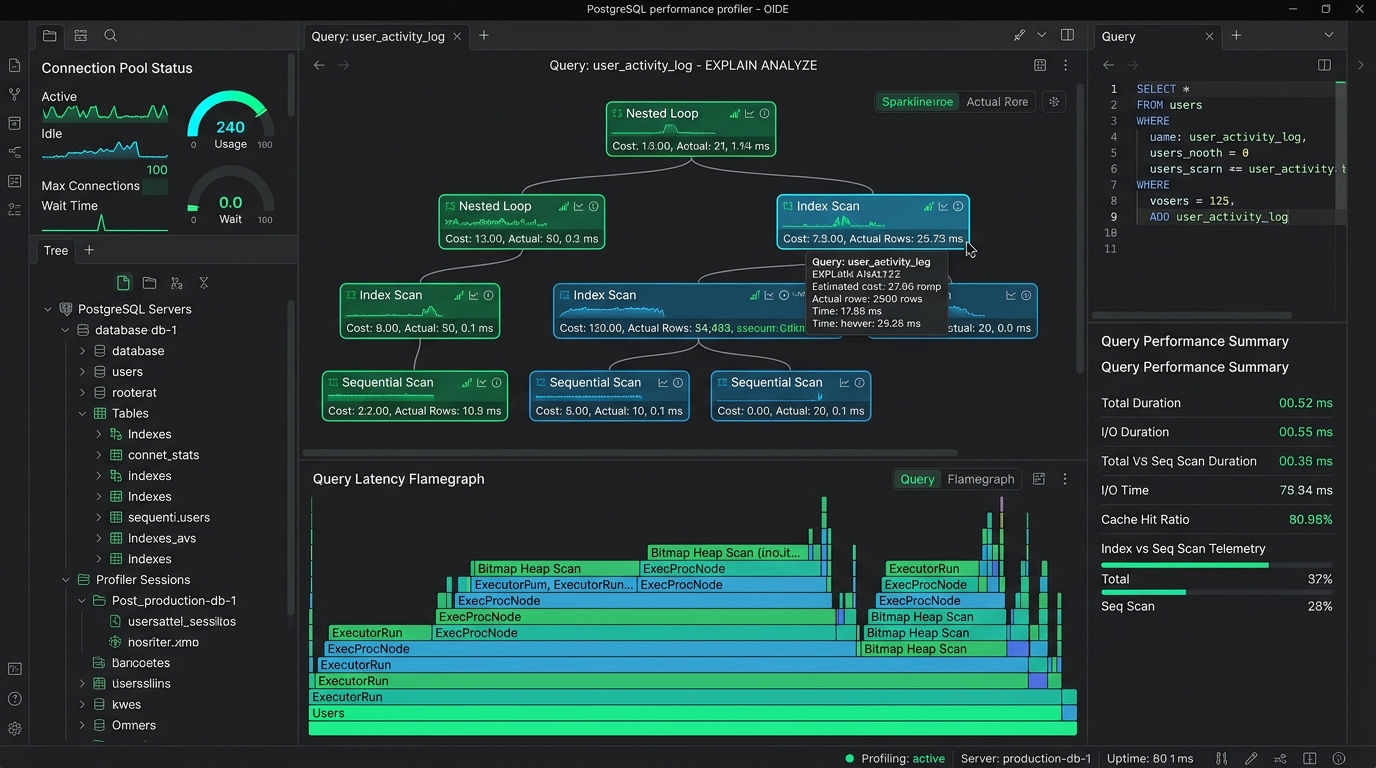
Where Bottlenecks Impact Your Customers & Revenue
Real-world friction, checkout hesitation, and performance barriers that directly reduce conversions and customer retention.
Checkout & Application Freezes During Traffic Surges
Unindexed queries scanning millions of rows, pegging database CPU at 100% and causing application-wide timeouts.
Deadlocks & Transaction Failures Costing Sales
Poorly isolated concurrent write operations locking database tables, causing customer orders or updates to fail.
Overpaying for Massive Database Instances
Throwing expensive hardware at slow queries instead of fixing underlying database indexes and connection pooling.
Slow Internal Reporting Hurting Business Decision-Making
Heavy analytical queries locking transactional tables, preventing customer-facing operations from completing on time.
How We Fix It: The 14-Day Performance Sprint
A structured, milestone-driven engineering roadmap delivered directly into your staging repository with zero downtime.
Slow Query Profiling
Enabling pg_stat_statements / slow query log to identify queries consuming 80% of execution time.
EXPLAIN Execution Plan Review
Deep EXPLAIN (ANALYZE, BUFFERS) inspection; designing targeted composite and covering indexes.
Non-Blocking Index Migration
Creating indexes concurrently (CREATE INDEX CONCURRENTLY) with zero table locking or downtime.
Memory Buffer Optimization
Memory buffer configuration tuning (shared_buffers, work_mem) based on server hardware specs.
Stress Testing & Alerting
Load testing under peak transaction volume and delivering automated slow-query regression alerts.
Tangible Business Outcomes in Your Codebase
What your executive and engineering leadership receives in your production repository. Zero theoretical slide decks—only verified speed improvements, clean code diffs, and documented operational stability.
Zero-Downtime Migration Scripts
Production-ready SQL migration scripts adding composite indexes with zero table lockouts.
Engine Tuning Configuration
Custom database configuration file tuned specifically for your hardware topology.
Query Performance Benchmark
Documented before/after execution plan comparisons showing 90%+ query runtime drops.
Supply Chain Inventory SaaS (PostgreSQL, 140M rows)
Core Search Query: 3,420ms | Database CPU: 95% at peak | Daily Timeout Errors
Explore Audit Scope ↗Verified Production Telemetry Delta
Core Search Query: 14ms | Database CPU: 18% at peak | Zero Timeout Errors
Related Engineering Workstreams
Running PostgreSQL at scale? Explore our dedicated PostgreSQL Optimization Service.
Looking to optimize API controllers upstream? Review API Performance Optimization.
Optimize Your Database Performance
No exploratory sales calls. Direct asynchronous code remediation and engineering triage.
Full confidentiality under mutual NDA prior to query plan inspection.