

React Performance Audit: Eliminate UI Freezes & Battery Drain
Isolate wasteful re-renders, optimize component state trees, and resolve memory leaks so your web application runs at a silky-smooth 60fps.
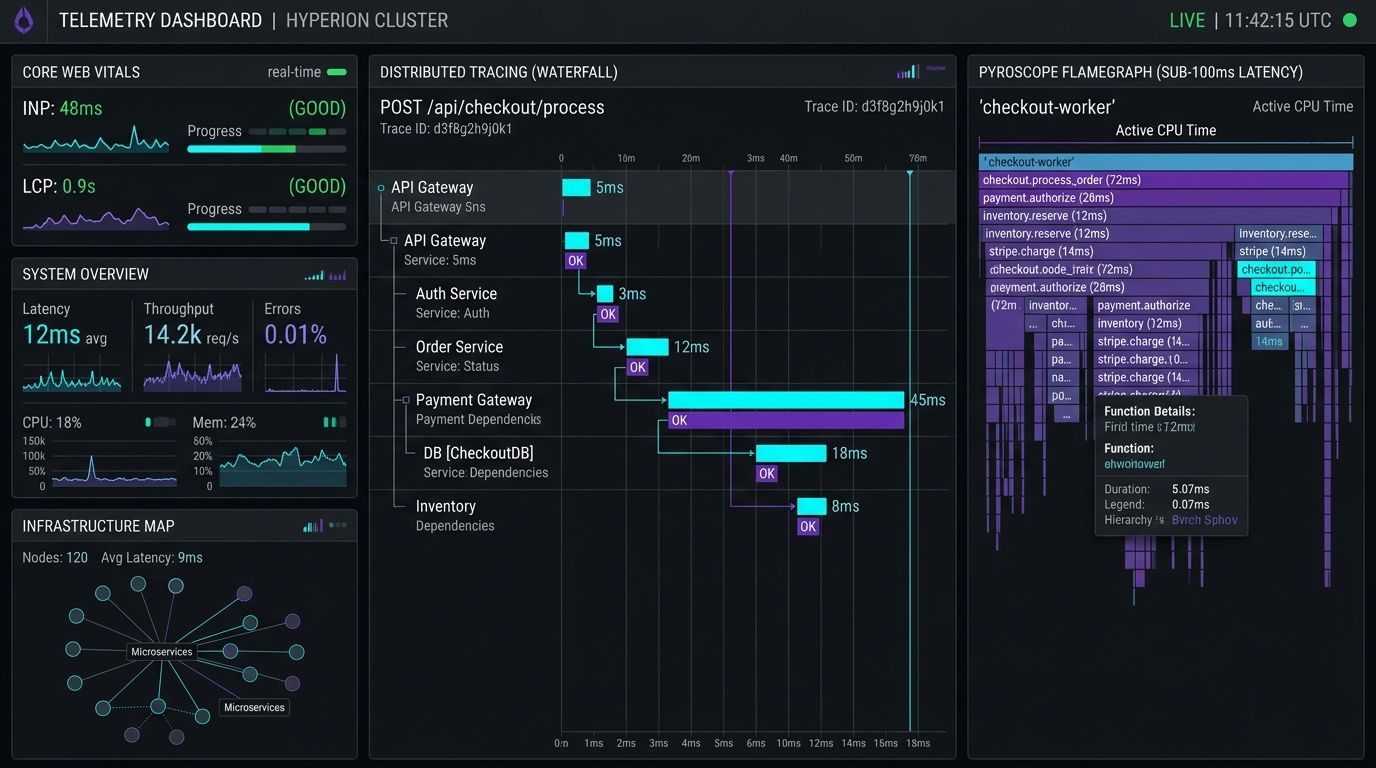
Where Bottlenecks Impact Your Customers & Revenue
Real-world friction, checkout hesitation, and performance barriers that directly reduce conversions and customer retention.
Laggy User Interface During Complex Operations
Form inputs, tables, and dashboards stuttering under user interaction, giving users an amateur and frustrating impression.
Cascading Re-renders Draining Device Battery
Mismanaged global state triggering hundreds of redundant component renders for a single user keystroke.
Browser Memory Leaks Causing Tab Crashes
Orphaned event listeners and un-cleaned subscriptions gradually consuming memory until the user's browser tab crashes.
Slow Rendering on Massive Data Sets and Lists
Unvirtualized product grids and enterprise tables causing severe browser stutter when scrolling through catalog data.
How We Fix It: The 14-Day Performance Sprint
A structured, milestone-driven engineering roadmap delivered directly into your staging repository with zero downtime.
Flamegraph Profiler Teardown
React Profiler flamegraph teardown to identify components with high render durations and wasted cycles.
Atomic State Refactoring
Splitting fat Context providers into atomic state selectors (Zustand / Jotai or scoped contexts).
DOM Virtualization Implementation
Virtualization implementation (@tanstack/react-virtual) for large data tables and lists.
Memory Leak Remediation
Auditing useEffect cleanup routines and detached DOM references in Chrome Memory Heap Snapshots.
Production PR Delivery
Pull request delivery, 60fps animation verification, and team state management runbook.
Tangible Business Outcomes in Your Codebase
What your executive and engineering leadership receives in your production repository. Zero theoretical slide decks—only verified speed improvements, clean code diffs, and documented operational stability.
State Architecture Refactor PR
Clean pull request with memoized component trees and atomic state selectors.
Before/After Flamegraph Report
Visual flamegraph report proving the elimination of wasted render cycles.
React Performance Best Practices
Engineering guidelines preventing memoization regressions in future feature development.
Enterprise Financial Modeling Dashboard (React SPA)
Table Filter Lag: 1,800ms | Memory Heap Growth: 400MB/hr | Frame Rate: 18fps
Explore Audit Scope ↗Verified Production Telemetry Delta
Table Filter Lag: 32ms | Memory Heap Stable | Frame Rate: 60fps locked
Related Engineering Workstreams
Migrating to or optimizing Next.js? Review our Next.js Performance Optimization service.
Looking to fix interaction delays on clicks? Learn about our INP Optimization Service.
Book a React Performance Audit
No exploratory sales calls. Direct asynchronous code remediation and engineering triage.
100% confidential under mutual NDA before code access.