

E-Commerce Conversion Rate Audit: Stop Revenue Leaking from Your Funnel
A comprehensive technical and UX audit identifying the exact friction points, latency delays, and checkout barriers costing you sales.
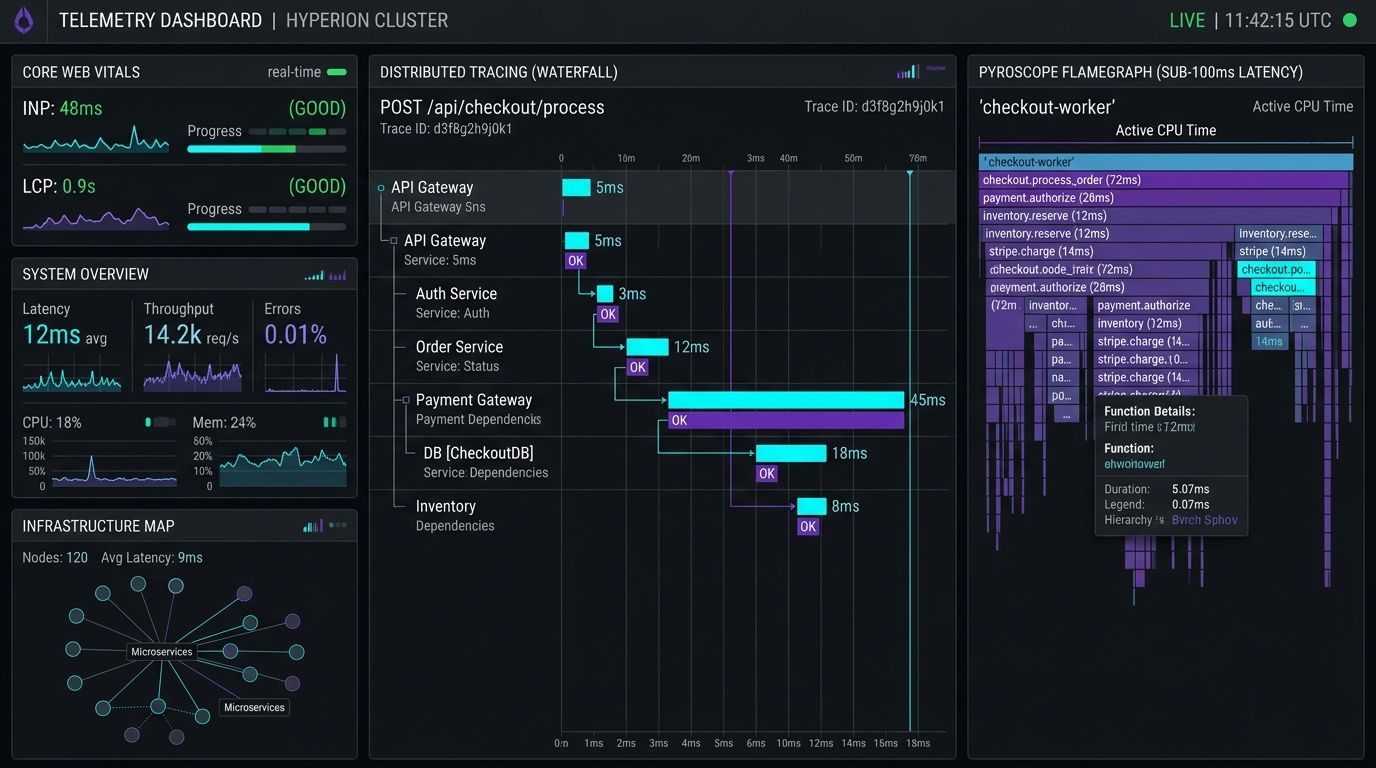
Where Bottlenecks Impact Your Customers & Revenue
Real-world friction, checkout hesitation, and performance barriers that directly reduce conversions and customer retention.
Revenue Bleed Along the Mobile Funnel
Every 100ms of latency between product discovery and cart drawer results in measurable drop-off that reduces overall store revenue.
Cart Drawer Hesitation & Micro-Freezes
Delayed drawer sliding, sluggish quantity selectors, and slow tax recalculations create hesitation at the most critical step.
Poor Landing Page Experience Burning Ad Budget
Traffic from paid Facebook and Google ads bouncing within 3 seconds due to slow hero renders and intrusive popups.
Unmeasured Friction Causing Silent Customer Loss
Traditional analytics report bounce rates but miss the interactive delays and micro-frustrations driving high-intent shoppers away.
How We Fix It: The 14-Day Performance Sprint
A structured, milestone-driven engineering roadmap delivered directly into your staging repository with zero downtime.
48-Hour Deep Teardown
Profiling RUM data, synthetic latency waterfalls, and conversion funnel analytics.
Financial Impact Modeling
Matching page load time milestones against Google Analytics 4 transaction logs to quantify lost dollars.
Code-Level Attribution
Identifying the exact 5 scripts or Liquid loops causing 80% of revenue-draining delays.
Remediation Backlog Compilation
Building the prioritized Engineering Remediation Backlog with estimated developer effort vs. conversion gain.
Executive Presentation
Delivering the C-level summary report and developer-ready implementation roadmap.
Tangible Business Outcomes in Your Codebase
What your executive and engineering leadership receives in your production repository. Zero theoretical slide decks—only verified speed improvements, clean code diffs, and documented operational stability.
Executive Financial Latency Report
Plain-English executive report linking milliseconds to lost revenue and blended ROAS drag.
Codebase Diagnostic Teardown
Engineering teardown isolating specific slow components, script tags, and database queries.
Prioritized GitHub Issue Backlog
Structured tickets ready for immediate developer assignment with estimated ROI.
Direct-to-Consumer Fitness Brand ($32M Revenue)
Mobile Interactivity Delay: 2.8s | Paid Ad Bounce Rate: 56% | Blended ROAS: 1.85x
Explore Audit Scope ↗Verified Production Telemetry Delta
Mobile Interactivity: 0.8s | Bounce Rate: 34% | Blended ROAS: 2.42x | Annualized Revenue Gain: +$1.4M
Related Engineering Workstreams
Looking for turnkey implementation? Explore our flagship Shopify Speed Optimization service.
Need deeper backend code inspection? Learn more about our Independent Code Audit services.
Request a 48-Hour Conversion Speed Audit
No exploratory sales calls. Direct asynchronous code remediation and engineering triage.
Completely async analysis. No access credentials required for initial audit.